How close is flu season where you are?
To better inform the patient community at highest risk of severe respiratory virus infections. Read more →
Your regional FluPulse trend over the previous 60 weeks
How to read this
FluPulse flu score, 0 to 100: county marked from above the bar, state from below. The range beside the county marker is the share of weeks in that score band that were followed by flu season within four weeks, in the lowest and the highest of the replayed seasons (weeks before onset); ± on the state marker is one standard deviation from 200 refits of the model.
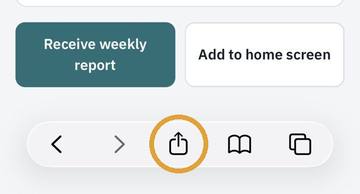
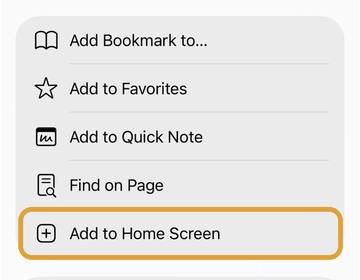
On iPhone: tap Share, then "Add to Home Screen". On Android: open the browser menu, then "Add to Home screen". FluPulse then opens like an app.
Across the country today
FluPulse across the USA this week
One dot per county, colored by this week's band; grey dots have no score this week. Tap a dot to open that county.
For {states}, CDC's county feed carries no emergency department rows, so every county there is scored on the one statewide series. Dots of the same color across those states share that one reading; they are not separate signals.
RSV score
No RSV scores today: this morning's RSV run did not complete. The flu tab is unaffected; RSV returns with the next run.
COVID score
No COVID readings today: this morning's COVID run did not complete. The flu tab is unaffected; COVID returns with the next run.
Measles
Please read
FluPulse is built from public surveillance data. It is not medical advice, not a diagnosis, and not a substitute for a clinician, and it describes an area, never a person. If you have symptoms, contact a clinician; in an emergency, call your local emergency number. FluPulse is not affiliated with the CDC, any state or national health department, or any test or vaccine maker; the guidance shown follows public CDC recommendations. Data are published with a lag and revised by their sources, and FluPulse is provided without warranty of any kind.
Flu and RSV: the score, 0 to 100, is the model's estimate of the percent chance that the local season begins within four weeks. How well that held varied from season to season, so the card and the meter show, for each color band, the range seen in past seasons. COVID: the reading says whether COVID emergency visits are rising, stable or falling, by a fixed rule on the emergency-department series, and nothing about what comes next. Measles: the tab reports what your state and CDC have published; a state with no reported case can still have one, and wastewater sampling covers only some counties.
FluPulse Services
The same models used to forecast the emergence of these respiratory viruses can be used or customized to inform and support your work or organization. These are examples of how your organization might benefit from our services.
- Academic institutions and NGOsSupport for academic projects funded by governmental agencies or nonprofit organizations that require an understanding of trends in respiratory viral infections, and use of these trends to support research or clinical activities.
- Clinical trial sponsors and CROsFor seasonal infection clinical trials (influenza, RSV, COVID): real-time automated alerts to clinical sites and participants, clinical site activation sequencing, seasonal trend and severity modeling, modeling to select optimal enrollment windows.
- Clinics and healthcare systemsCounty-level onset timing for emergency department planning and staffing, surge planning and high-risk patient outreach, by region.
- Consumer health and pharmacy brandsWeekly forecasts of when flu demand will rise in each market, to inform more cost-effective inventory volume and stocking and to drive the timing of social media campaigns for seasonal products.
- Senior living communities, daycare centers, wellness centers, gyms and businessesWeekly alerts for each location to guide the setting of visitor policies and the planning of infection-control staffing, and data to drive vaccination campaigns and the stocking of infection-control products.
- Data licensing and APISubscribe to the county, state and country scores as a feed for news, weather and health applications.
All profits from FluPulse services are donated to charity.
Explore servicesHow FluPulse works
Last updated September 27, 2026. Figures are filled from the validation files at each build (model version 3, September 21, 2026).
What FluPulse shows
FluPulse gives a score for flu and RSV, a reading for COVID, and a report for measles, computed daily for every US county, and Puerto Rico’s municipios, from public surveillance. The flu and RSV score, 0 to 100, is the model’s estimate of the percent chance that the local season begins within four weeks: the fitted probability, times 100. How well that estimate held varied by season. In the flu replay, weeks before onset that scored 25 to 69 were followed by onset 98 percent of the time in 2022-23, 33 percent of the time in 2023-24 and 10 percent of the time in 2024-25 (80, 175 and 153 such weeks), so the county card and the meter show, beside the county score, the lowest and the highest of those season shares for its band; for RSV the same range comes from its own replay. COVID gives a reading, rising, stable, falling or low, because COVID has no season to forecast. For flu and RSV, green is 0 to 24, amber 25 to 69, red 70 to 100; on the COVID tab red is rising, amber stable, green falling or low. Grey is no reading this week.
“Season begins” is local and fixed: the week a place’s own emergency-department curve for the virus reaches half of what will be its peak, for flu and for RSV alike. It ends when the curve has been well below the peak for two weeks.
As flu season approaches, the forecast adds an onset window, the span of weeks within which the season begins with 80 percent probability. It is shown only when four weeks wide or narrower, and in the replay held the true onset 80 times in 100 (83, 92 and 69 in the three seasons). RSV has no window yet.
What goes in
For the United States, all inputs are federal public data from the CDC and NOAA, with two exceptions since October 8, 2026: Washington counties read the Washington State Department of Health’s county emergency department file, and New York City’s five boroughs read the NYC Health Department’s influenza emergency department file by borough, because CDC’s public county file carries no rows for either. Nothing else enters the US tabs, and wastewater is not used for any virus. Places outside the United States are colored from their own national or regional agencies’ feeds and carry no score (see Other countries).
- Emergency department visits for the virus as a share of all visits, by county (CDC NSSP). All three tabs.
- Laboratory tests positive for flu, statewide (CDC NREVSS). Flu.
- Doctor visits for flu-like illness, statewide, against the state’s summer level (CDC ILINet). Flu.
- Hospital admissions with the virus per 100,000 residents, statewide (CDC NHSN). RSV.
- Mean outdoor temperature over the seven days ending the Saturday of the surveillance week being scored (NOAA). Flu and RSV.
How the scores were built
Flu and RSV share one design: a statistical model fitted to past seasons at 70 locations in 24 states (50 counties; the locations are metropolitan trial sites, so some counties appear more than once), then replayed week by week. Every figure below is replay performance from leave-one-season-out testing (the model refitted without one season and scored on it), not live performance, and the replay is generous in four ways: the inputs are the sources’ values as revised to today, not as first published; with three flu seasons, each fold trains partly on seasons after the one tested; the regularization, features and band edges 25 and 70 were chosen on these same seasons; and the fit drops location-seasons whose series never defined a season, a filter the live page cannot apply. The first live season is 2026-27; every published score is archived to be scored next spring against what happened. Refits on 200 resampled sets of locations give the ±, one standard deviation: it measures dependence on which locations were in the fit, not how much a season can differ, which is why the county marker shows the season range instead.
- Flu: three seasons, 2022-23 to 2024-25; 207 location-seasons, 8,901 location-weeks. Three location-seasons were excluded because their series could not define a season. The state score was fitted separately to eight seasons of state data, 2016-17 to 2024-25, excluding 2020-21, when there was no flu season. Temperatures are NOAA station means in training and live alike (model version 3, September 21, 2026).
- RSV: four seasons, 2022-23 to 2025-26; 233 location-seasons, 10,089 location-weeks. 47 were excluded, 42 because the season was already under way when county data began, five because the series could not define a season.
The COVID reading is a fixed rule, not a model: the mean of the last two published weeks of the emergency-department share against the mean of the two weeks before. Rising is at least 15 percent and 0.05 percentage points higher; falling is the mirror; low is stable under 0.25 percent of visits; stable is the rest. Both conditions are needed so that a move from 0.10 to 0.12 percent, a 20 percent rise of two hundredths of a point, does not read as a trend. The card states both means. There is no COVID score because COVID comes in waves, two or three a year, and most places are inside or just past one at any time: on September 17, 2026, 89 percent of counties were.
How well they work
AUC is the probability that the score ranks a week that was followed by the season within four weeks above one that was not; 1.0 is perfect, 0.5 a coin toss. Brier measures how close the probabilities are to what happened; 0 is perfect. The weeks before local onset are the test that matters, since a season under way is easy to see.
| Flu, county | RSV, county | |
|---|---|---|
| Weeks before onset, AUC | 0.945 | 0.966 |
| Weeks before onset, Brier | 0.069 | 0.056 |
| All weeks, AUC | 0.983 | 0.984 |
| All weeks, Brier | 0.047 | 0.045 |
| State score, AUC, all weeks and before onset | 0.959; 0.916 | not validated separately |
Calibration. Pooled over the three flu seasons, predicted and observed agree within 10 points across eleven score bins (20 to 30 was followed 31 percent of the time, 60 to 70 60 percent, 90 to 100 98 percent). Season by season the agreement is far looser, as the 25 to 69 figures above show; pooling hides what the ± cannot see. RSV is close from 30 upward (60 to 70 71 percent, 90 to 100 98 percent) but 20 to 30 was followed only 14 percent of the time, 9 percent before onset: that band reads about ten points high, and an amber chip just above 25 is a weaker signal on the RSV tab than on the flu tab. Most of the RSV skill is in the emergency-department share alone (AUC 0.963).
COVID. Checked against a fixed wave definition on the same 60-week histories (a peak at least twice the trough before it, onset the first week at or above half the peak, the end after two weeks below half). Across the 2,346 counties with their own series the reading was rising in 87 percent of onset weeks, falling in 70 percent and rising in 6 percent of the weeks two and three after a peak, and flipped for one week and back in 6.3 percent of county-weeks; on the 51 state series, 84, 59 and 3.8 percent. A three-week version was dropped because it still read rising 37 to 45 percent of the time two and three weeks after a peak. The thresholds are judgment, and the check is against a wave definition in the same data, not against outcomes.
Measles. No season and no score: measles arrives by introduction and spreads where vaccine coverage is low, so the tab shows the number of cases reported. For each location requested, the following are reported: cases the state reported to CDC in the latest week and this year against last; whether measles virus was found in wastewater serving the county in the last 28 days, or the nearest detection within 60 miles; and the state’s two-dose MMR coverage among kindergartners against the roughly 95 percent that stops spread. Red means a detection in the county or state cases this week; amber a detection within 60 miles or state cases in the last eight weeks; green neither. Counts are provisional, wastewater covers a few hundred counties, and a state with no reported case can still have one. English only.
Other countries. Places outside the United States carry no FluPulse model score: the US model was withdrawn abroad on September 25, 2026 until each country is refitted on its own history to the same standard. Each place is colored by this week’s reported level on its own agency’s feed, by one rule. Red when lab positivity is 10 percent or more, the WHO and ECDC influenza epidemic threshold, and, where the feed publishes one, consultations for flu-like illness are 1.25 times their summer level (the summer mean plus two standard deviations). Amber when one of the two is at that level and the other is not, or when positivity is 5 percent or more or consultations 1.1 times their summer level for two weeks running. Green otherwise; grey where the week rests on fewer than 30 specimens or the feed has not published. The feeds are listed under Sources. The rule has not been tested against onsets abroad; the one test of a similar rule used positivity alone, on ten countries. A 60-week curve, where shown, is the measurement as revised to today, not an archive of forecasts.
What it cannot do
- A score or reading for an area, not a person. It says nothing about any one person’s risk; a county can run early or late against it, and the season range and the window show how much.
- Surveillance is published about a week late and revised; a score can change when last week’s data are corrected.
- Where a state publishes no county emergency-department data (Alabama, Alaska, Arizona, Arkansas, California, Connecticut, Florida, New Hampshire, North Dakota, Ohio, Pennsylvania, Rhode Island and South Dakota, as of this build), every county is scored on the one statewide series and shares one reading; elsewhere a county without a series of its own rests on a neighbor’s. Puerto Rico’s 78 municipios have no emergency-department series and are scored on the reduced model, from positivity, flu-like illness and temperature alone.
- The emergency-department share depends on who goes to the emergency department and who is tested there; a low share where little testing is done is not low disease. Lab positivity for a state on fewer than 30 specimens is shown but not scored: the score uses the latest week with at least 30 specimens if there is one within three weeks, and the week-on-week change pairs it with the last such week before it; with no such week the score runs without positivity.
- Flu and RSV rest on three and four seasons of county data, and the replay figures above are not live performance (see How the scores were built). The wording for a season under way (rising, past the peak, winding down) follows rules not yet tested the same way.
- RSV: no 60-week history yet; the fit used metropolitan locations, so a small county can swing on a handful of visits; and in Florida and Hawaii, where RSV runs early or year-round, the summer level is not a quiet one.
- COVID: the reading says nothing about what comes next; it uses the last four published weeks, and a turn shows one to two weeks after it begins. English only.
- Measles: what has been published, not what is present; NNDSS counts are provisional and by report week; wastewater sampling covers a few hundred counties; the CDC headline is copied by hand each week. English only.
Sources
CDC NNDSS weekly provisional tables, CDC NWSS wastewater surveillance for measles and CDC SchoolVaxView kindergarten coverage (measles tab); CDC NSSP emergency department visits (influenza, RSV and COVID-19); CDC NREVSS clinical laboratory positivity; CDC ILINet outpatient visits; CDC NHSN hospital admissions (RSV and COVID-19); NOAA GHCN-Daily station temperatures; outside the United States, ECDC ERVISS, Réseau Sentinelles, the Swiss Federal Office of Public Health, the Public Health Agency of Canada, Taiwan CDC NIDSS and WHO FluNet. FluPulse is not affiliated with any of them.